Can you remember those days when we had to measure the melting point of paraffin or wax using a thermocouple? The current from the thermocouple was recorded using a Deflection Galvanometer. But, at the end of the day, only a set of manipulated data used to be recorded in the notebook. Let us repeat that experiment again. But, this time, we are going to take help from some newer electronics.
A LM35 from TE is used as the temperature sensor. An Arduino Uno board is used to record the data. I am using a ADS1115 as the Analog-to-digital (ADC) with 16bits. LM35 output is \pm 10mV/C. So it is difficult to measure temperature accurately using the on board ADC of Arduino Uno which is only of 10bits. I am including the code which is used with the Arduino.
Code for Arduino to Record Temperature
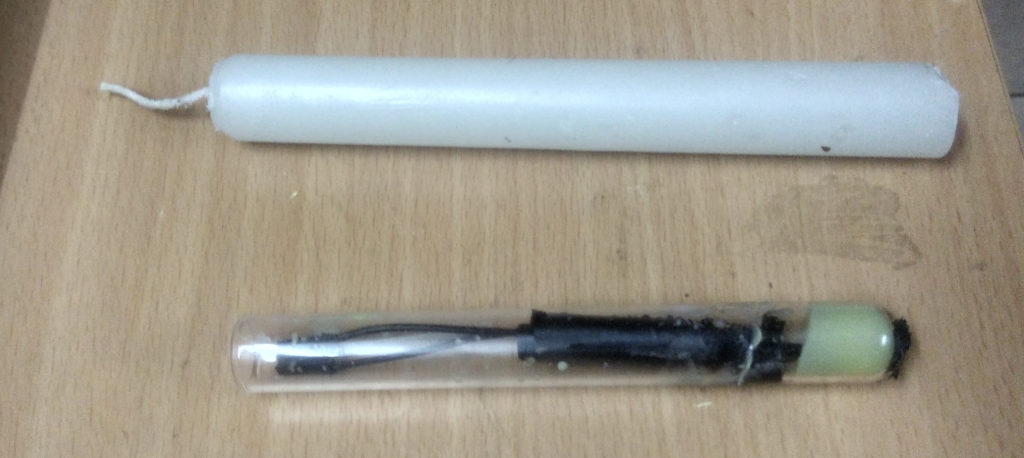
Next, I took a little bit of candle wax into a test tube and placed the sensor inside. Then, I heated the test tube in a heated water bath to maintain the temperature uniform.

Since, the temperature is non-uniform while heating, the measurements are not proper while heating. That is why I am going to record the data while the wax is cooling down. I am going to heat the water bath up-to 80C with the test tube in it. Then, the system will cool down by itself by dissipating heat into the surrounding.
Note: So, you may think that I am measuring the freezing point, not the melting point. Actually, both the melting point and freezing point are supposed to be same. But, in measurement it is never the same. Melting point is always lower than the freezing point. This happens due to the temperature sensor. There is no thermometer which measures the temperature instantly. The sensors has to attain the temperature to show the proper temperature. By the time the sensor reaches the temperature, the system temperature already moved forward. That is why the system temperature has to be varied very slowly to get more accurate result. But, while heating, the temperature varies very rapidly and non-uniformly. So, it is better to use the cooling cycle.
Now, There are two ways to record the data for this setup.
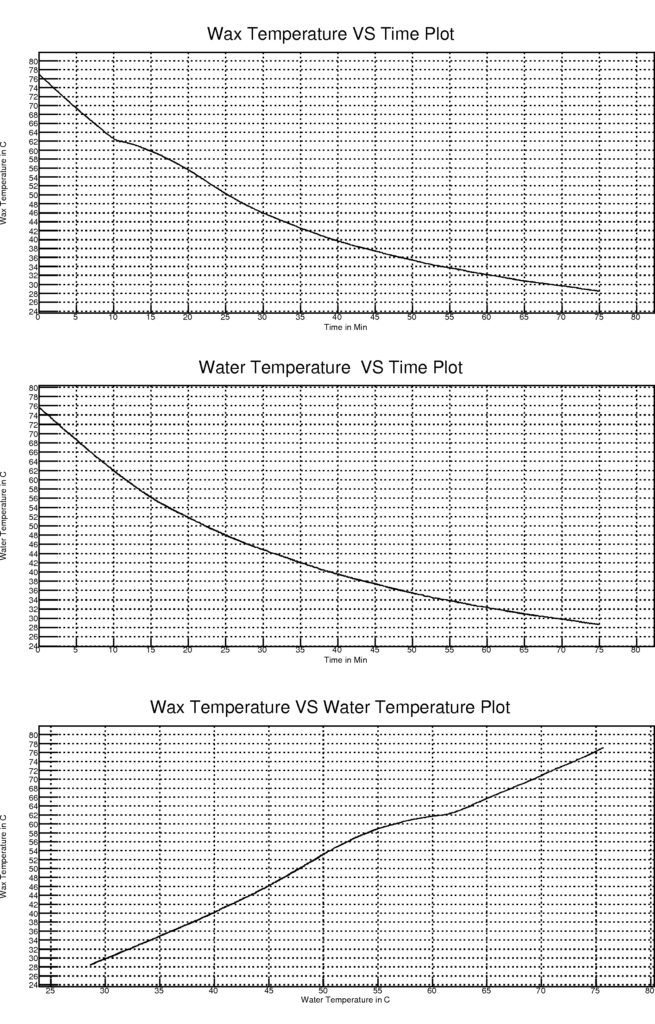
One is just to record the temperature of wax. The wax temperature supposed to fall exponentially with respect to time if the melting point is not falling in this range. But, in this case, there will be a flatter region at the freezing/melting point. The other way is to record temperature for both the wax and water bath. The temperature of water bath will fall exponentially with respect to time but the wax temperature will not. So, a plot of Wax Temperature VS Wax Temperature will have a more clearer view of the melting point.
I am here adopting both the techniques. Because, I have two sensors.
Find the data recorded in the event bellow. The first column is time in seconds and the second one is temperature in C.
I wrote a simple code to plot this data. Here is the code.
Code For Wax Melting Data Analysis
We will get three plots after running the code.

From the first plot itself we can estimate the melting point. But, this method has a limitation. If the room temperature is varying at a high rate causing the heat dissipation irregular, then the flat resign near melting point will vanish under the waviness of the dissipation affect. For that case, we need a reference temperature. Here, the reference is the water bath. The difference in changes of wax temperature and water temperature will give a unaffected measurement. So, a scatter plot of Wax Temperature VS Wax Temperature will have a more clearer view of the melting point. If the melting point of wax was not in that range, this plot has be linear.
I introduced some fine grid. The freezing point can be clearly seen at 62.5C. The freezing region is not properly flat because the wax has more than one compound in it.
Now, it is time to write the conclusion. The Wax we used here is a type of Beeswax after seeing the melting point. I am very happy that the retailer who sold the candle to me is honest.