I hope that you have gone through the previous example. We have calculated the resistance from a real V-I dataset. Now, we will try to improve the measurement by using some other tools based on the same experimental setup. This example requires a little knowledge on Histograms to understand it properly.
In this example too, I have the data of voltage and current readings across a 1K resistor. The voltage was varied from 0 to 5V and the current reading was noted using a the same instrument. Now, there are one famous way to improve the reading is to take more measurement points (i.e. for 0.1V, 0.2V, 0.3V, ……, 4.9V, 5.0V). In this case, the plotting software will be same.
Now, I do not want to alter the process of measurement and also I want to learn something more. So, I decided to record measurements for the same voltage points but for this this time, I will record a set of hundred measurements (i.e. 100 current measurements for one voltage point). The Data file look like this.
We have repeated the same measurement again and again. Since the data acquirement system has some Gaussian Noise in it, each measurement differs from other by a little amount, keeping the mean at true value. We will use this property to calculate the mean and error in each set of measurement for one voltage point. Here is the link for the code.
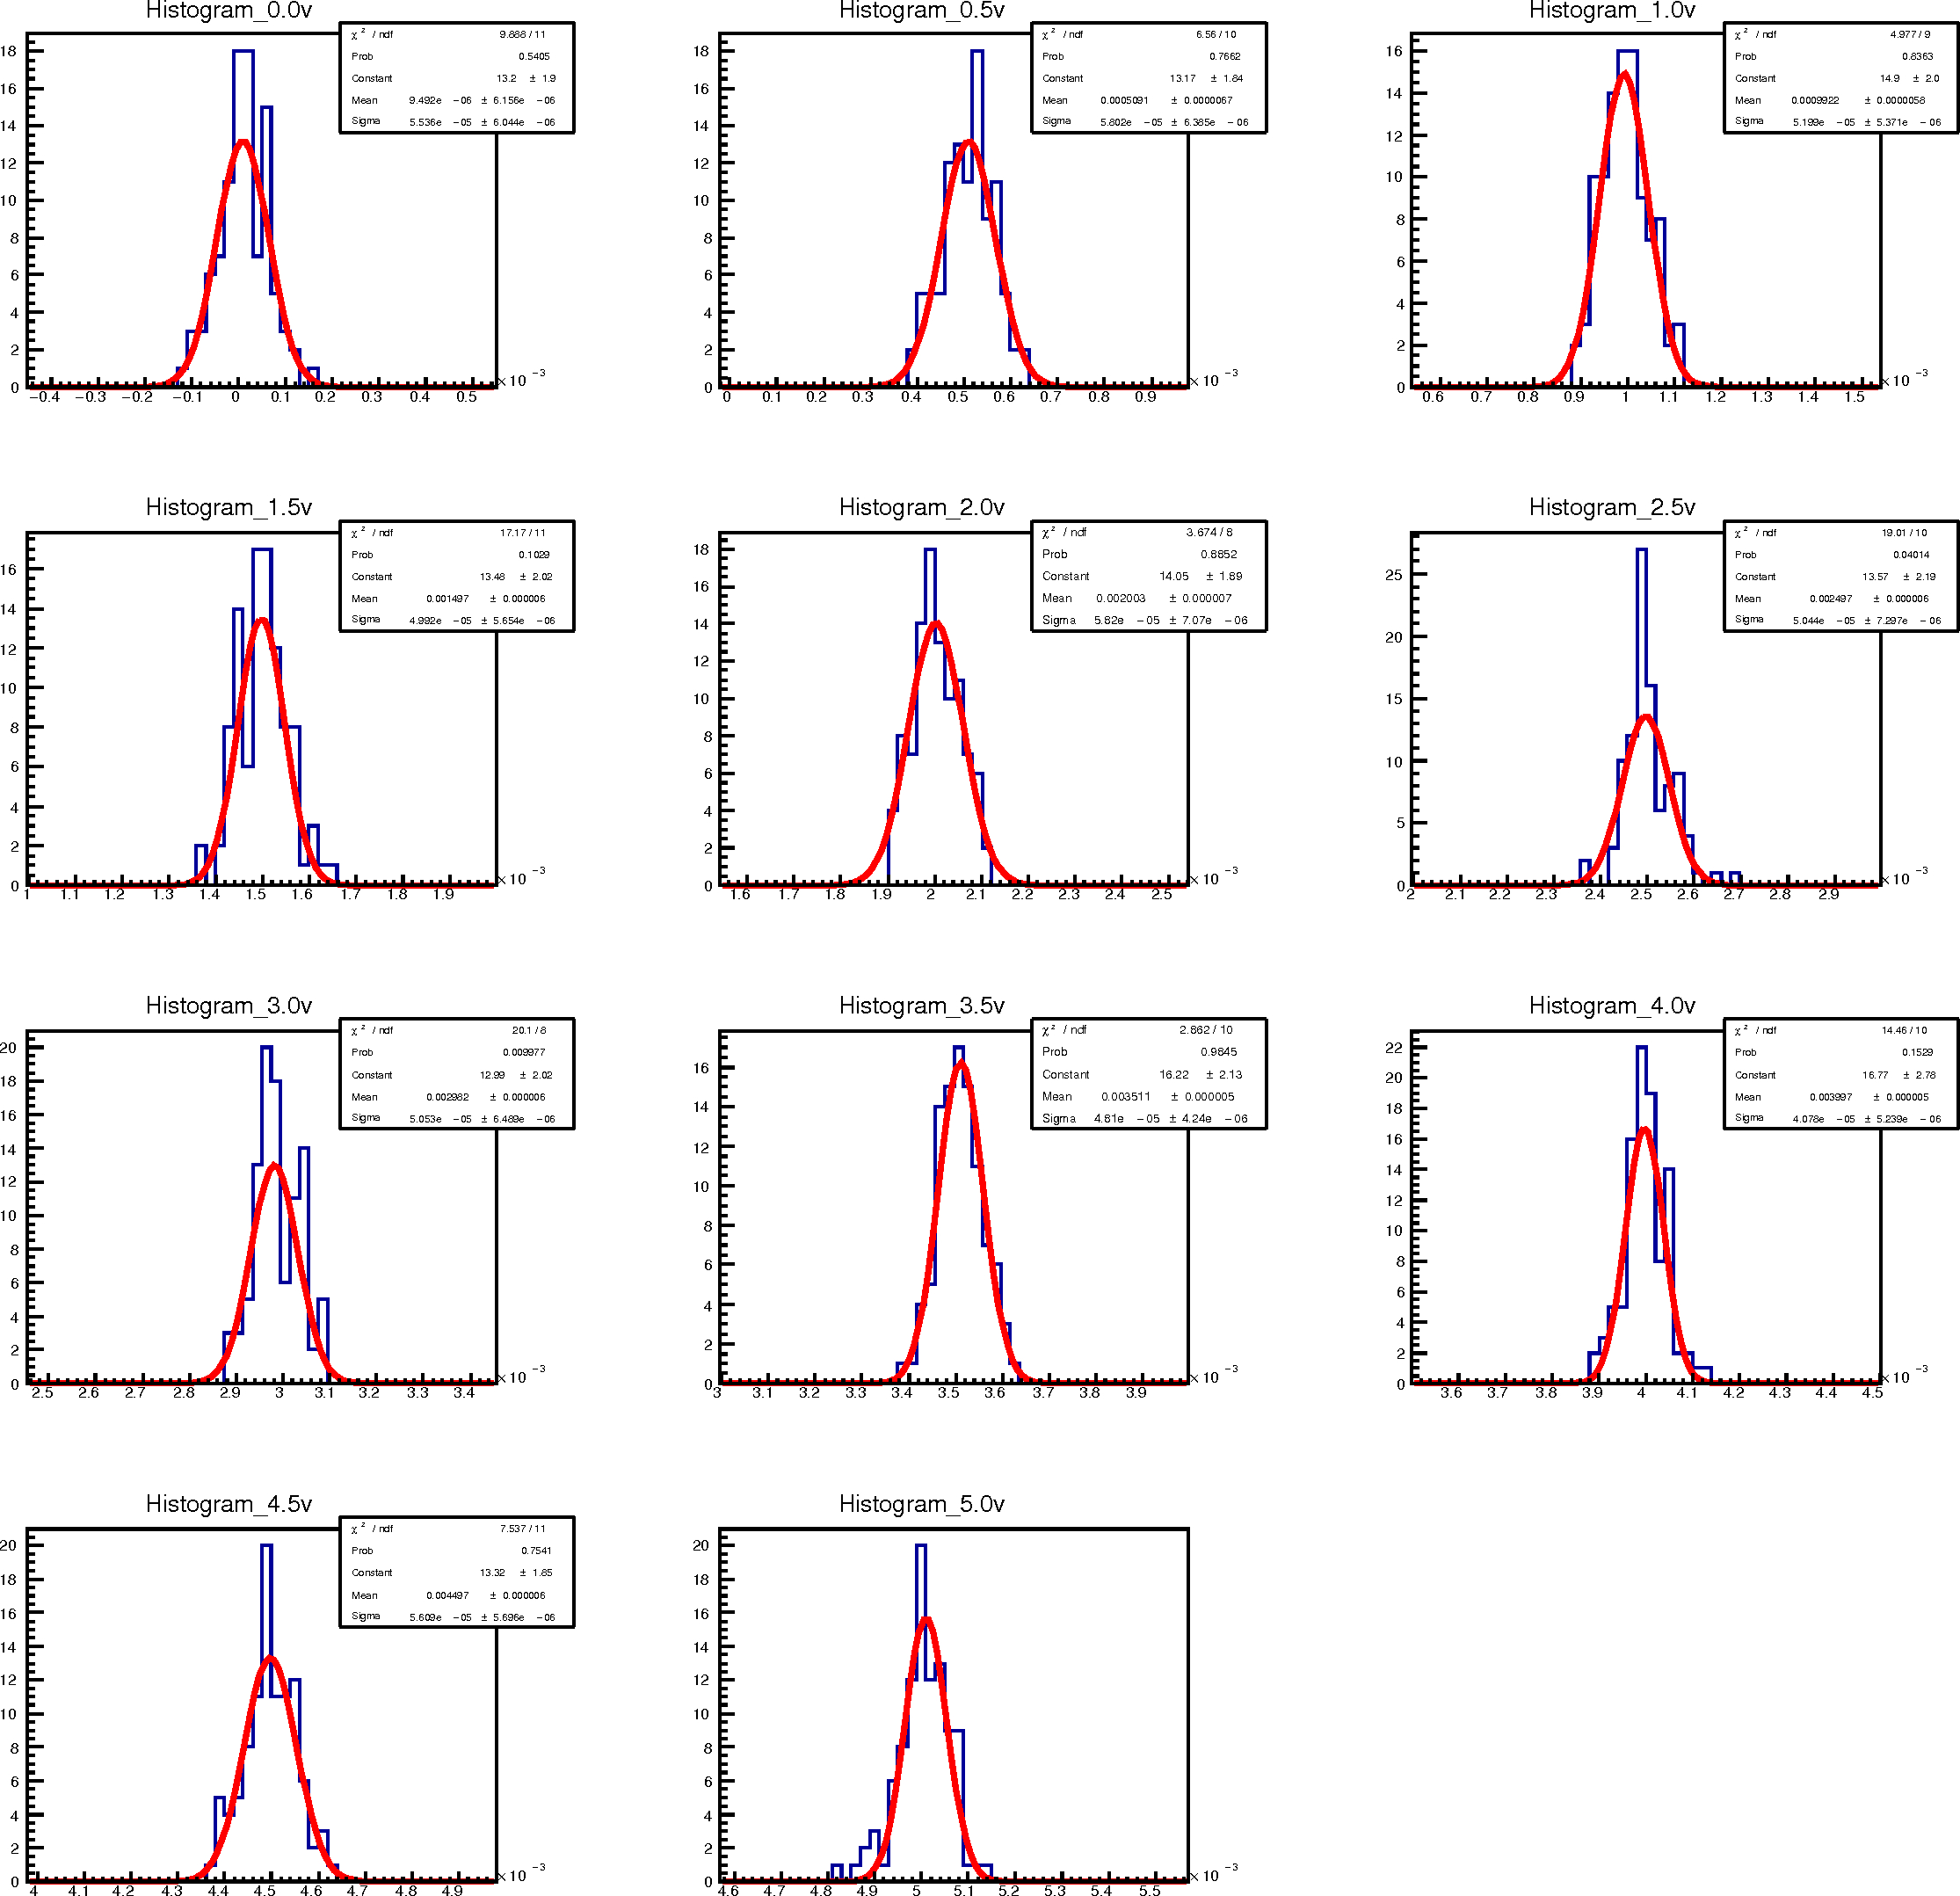
Here, we created one histogram for each voltage point, then filled with the current reading corresponds to this voltage point. Later the plot was fitted with Gaussian and all the parameters were extracted (i.e. mean, sigma or error). After executing the program, you will get a ps file like this.
The ps file will contain two pages containing the following pages.
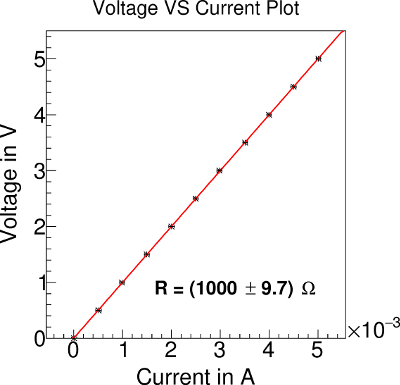
As you can see here, the calculated value of the resistance is now exactly 1000. But the error in measurement, which is 9.6, is same with the error calculated in the previous example. And this is the fun factor of this example. This is because we did not change the process of acquiring data or experimental setup. So, we ended up having more accurate result but with the same systematic error. You can record more no of data sets which will increase the result more accurate, but the systematic error will be the same. If you want to get the statistical error also, then, just plot the TGraphErrors with both the X & Y errors as 0 (Try it). This statistical error will be much less as it depends not on the experimental setup but on the number of data points recorder.
If we have tried to increase the accuracy in measurement by just recording more voltage points instead, then the error in the measurement will also decrease. Because, in this case, we have actually changed the experimental setup which is in terms changing the error in measurement. Here, what you see is actually the statistical error which decreases with increased number of data points, but does not reflect the systemic error.
Tags: TGraphErrors, TH1, TLatex, TPostScript