Here, I will be giving you a very basic and simple example of the use of ROOT package. In this example, I have the data of voltage and current readings across a 1K resistor. The voltage was varied from 0 to 5V and the current reading was noted using a an arbitrary instrument which has certain level of accuracy. The Data file look like this.
Our goal is to to plot the Voltage VS Current plot. Then calculate the resistance value along the error from the slope of the curve. And print that value on the plot. Here is the link for the code.
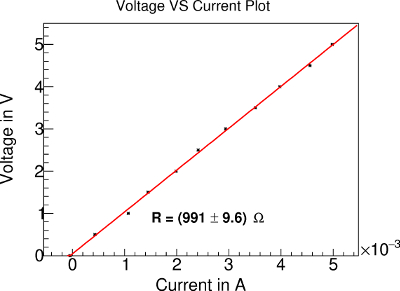
Copy the code and save as a cpp file. Edit the path to the data file inside the code. Compile and then execute it. It will generate a ps file containing a plot like this.
I have tried to explain each and every line in the code. You can play with the parameters to make the plot more attractive.
Next, we will make this basic example a little complicated in order to learn more about ROOT. And also, we will try to learn how to improve in the measurement using the same experimental setup. In other words, the resistance value calculated here should be 1000 not 991.
Tags: TGraph, TLatex, TPostScript